Six systems. Six numbers.
None of them agree.
Leadership sets the strategy, verticals, geographies, temp/perm mix, runs the weekly pipeline and desk reviews, forecasts revenue and cash, and manages the bank and funding relationships. The chronic pain at this level is simple: the numbers live in systems that don’t agree, so owners run the firm on exported spreadsheets, every weekend.
In a 1 to 5 person agency, leadership is the hat you wear late at night with a coffee and a pivot table, and Zoho One covers it, along with every other hat, at the same $37 licence. And if you ever sell, staffing is one of the most acquired industries there is, clean data in one system directly raises your valuation.
Six ways owners lose the weekend.
Six systems that don’t agree
The ATS says 14 placements, the CRM says 12, accounting says 13 invoiced. All three are right in their own little world, and the firm runs on whichever one the loudest person quotes.
The weekend export ritual
Every weekend: export from the ATS, export from accounting, export from payroll, paste into the master sheet, fix what broke. The owner is the ETL pipeline, unpaid.
Meetings start with archaeology
The first twenty minutes go to reconciling whose number is right. The decision, the actual point of the meeting, gets whatever time is left.
Management by post-mortem
DSO crossed 45 days three weeks ago. One client quietly became 26% of revenue. Fill rate slipped under the floor. You find out in next month’s review, after the damage compounds.
The BI project that never ships
The licence was the cheap part. The ETL project, the consultant, and the standing argument about definitions are the real cost, which is why the dashboard is still a mock-up.
The valuation discount
Staffing is one of the most acquired industries there is. Buyers pay for clean, provable numbers, and discount hard for a business that lives in disagreeing spreadsheets.
The meeting starts at the decision.
That’s the flagship: the leadership auto-digest. Fill rate, GP, DSO and pipeline delta land before the call, and nobody says “let me pull that up.” This is the board it reads from.

Three more engines run beside it.
Threshold alerts, not post-mortems
Fill rate drops below your floor, DSO crosses 45 days, one client passes 25% of revenue → leadership gets the alert the day it happens, not in next month’s review.
The analyst on demand
Ask Zia mid-meeting: GP by recruiter this quarter, fills by client, margin by vertical → the chart appears in seconds. No analyst queue, no SQL, no waiting.
The board pack, built on schedule
Analytics exports the monthly pack to Zoho Show or PDF on schedule → same charts, same definitions, zero assembly weekend. The bank and your investors see the same truth you do.

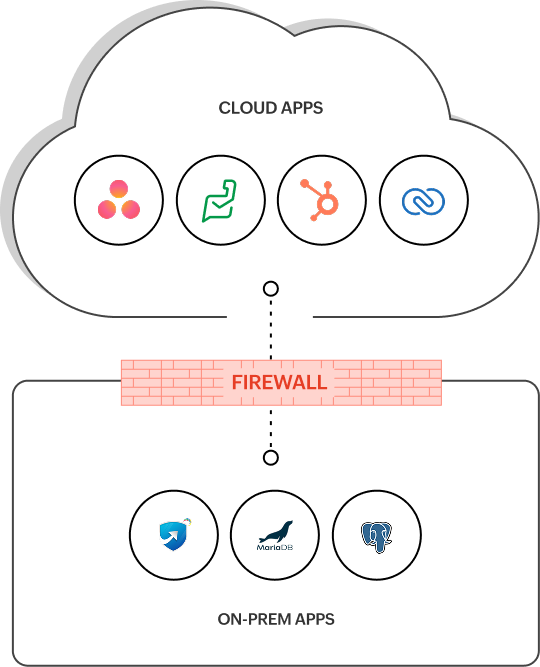
The licence is the cheap part.
The expensive part is the integration project that makes the BI tool tell the truth. All prices est., current list.
The reporting stack today
Plus the consultant, the connectors, and the standing argument about whose number is right.
The same jobs, on Zoho
Front, middle and back office were born in the same database, so Analytics joins them in one query. Annual pricing, USD list.
The apps this team lives in, and what each one does here.
The workflow comes first. These are the apps we wire around it. Not a feature list: the jobs each app does for a staffing agency’s leadership, specifically.
Zoho Analytics
- The exec six-pack: revenue, GP per desk, fill rate, DSO, concentration, redeployment
- Native joins across CRM, Recruit, Workerly, Books and People, no ETL
- Drill-down from any tile into the department behind it
- Due-diligence-grade history when a buyer or bank comes calling
Ask Zia
- Plain-English questions answered mid-meeting: GP by recruiter this quarter
- Margin by vertical when a desk lead challenges the strategy
- Fills by client, drawn as a chart in seconds, no analyst queue
Zoho Cliq
- The leadership channel where the weekly digest lands
- Threshold alerts the day a KPI crosses its floor
- Scheduled dashboard snapshots instead of emailed screenshots
Zoho Show
- The monthly board pack exported on schedule, same charts, same definitions
- Bank and investor updates that match the live dashboards
- Zero assembly weekends, ever
Zoho Projects
- Strategic initiatives tracked where the work happens, not in a quarterly slide
- New-vertical and new-geography launches with owners and dates
- Integration and implementation plans visible to the whole leadership team
Zoho Flow
- The threshold-alert wiring: DSO, fill-rate floor, client concentration
- The credit-hold flag that Finance raises and Sales sees
- Outside systems, bureau, bank, data providers, kept in the picture
One query. One truth.
| You’re paying for | Zoho One does it with |
|---|---|
| Tableau / Power BI | Zoho Analytics. Tableau still wins on exotic visualization polish, but both it and Power BI need someone to pipe staffing data in, and that project is the real cost. |
| Bullhorn Analytics | Zoho Analytics, included in Zoho One, not a per-user add-on. ✓ |
| InsightSquared-type staffing BI | Zoho Analytics, prebuilt for staffing by us. The six-pack arrives configured, not as a blank canvas. ✓ |
| An analyst to run queries | Ask Zia, natural-language querying for everyday questions. ✓ |
| Emailing dashboards around | Cliq + Analytics, scheduled snapshots to the leadership channel. ✓ |
| Initiative-tracking decks | Zoho Projects / Sprints. ✓ |
| Google Sheets sprawl | Retired by the joins themselves. When the systems agree at the source, the master spreadsheet has nothing left to reconcile. ✓ |
Two of the systems Analytics joins, Zoho Recruit’s Staffing Agency edition and Zoho Workerly, are their own line items on top of Zoho One, joined natively all the same.
The late-night pivot table, retired in four scenes.
The digest lands before the call
Fill rate, GP, DSO and pipeline delta are in the Cliq leadership channel and your inbox before anyone logs in. The meeting starts at the one flagged item, Client K’s concentration, not at reconciliation.
A question gets answered in the room
A desk lead asks whether the new vertical is actually more profitable. You type the question into Ask Zia and the margin-by-vertical chart is on the screen before the discussion moves on.
An alert fires the day it happens
DSO on one account crosses 45 days. Finance gets the collections task, Sales sees the credit-hold flag on the CRM account, and you see both in the leadership channel, three weeks earlier than the old spreadsheet would have told you.
The board pack goes out on schedule
Month-end lands at the end of the week and nothing changes: Analytics exports the pack on schedule, same charts, same definitions the bank saw last month. Your weekend contains zero pivot tables.
One system. One version of the truth.
A valuation story that survives due diligence.
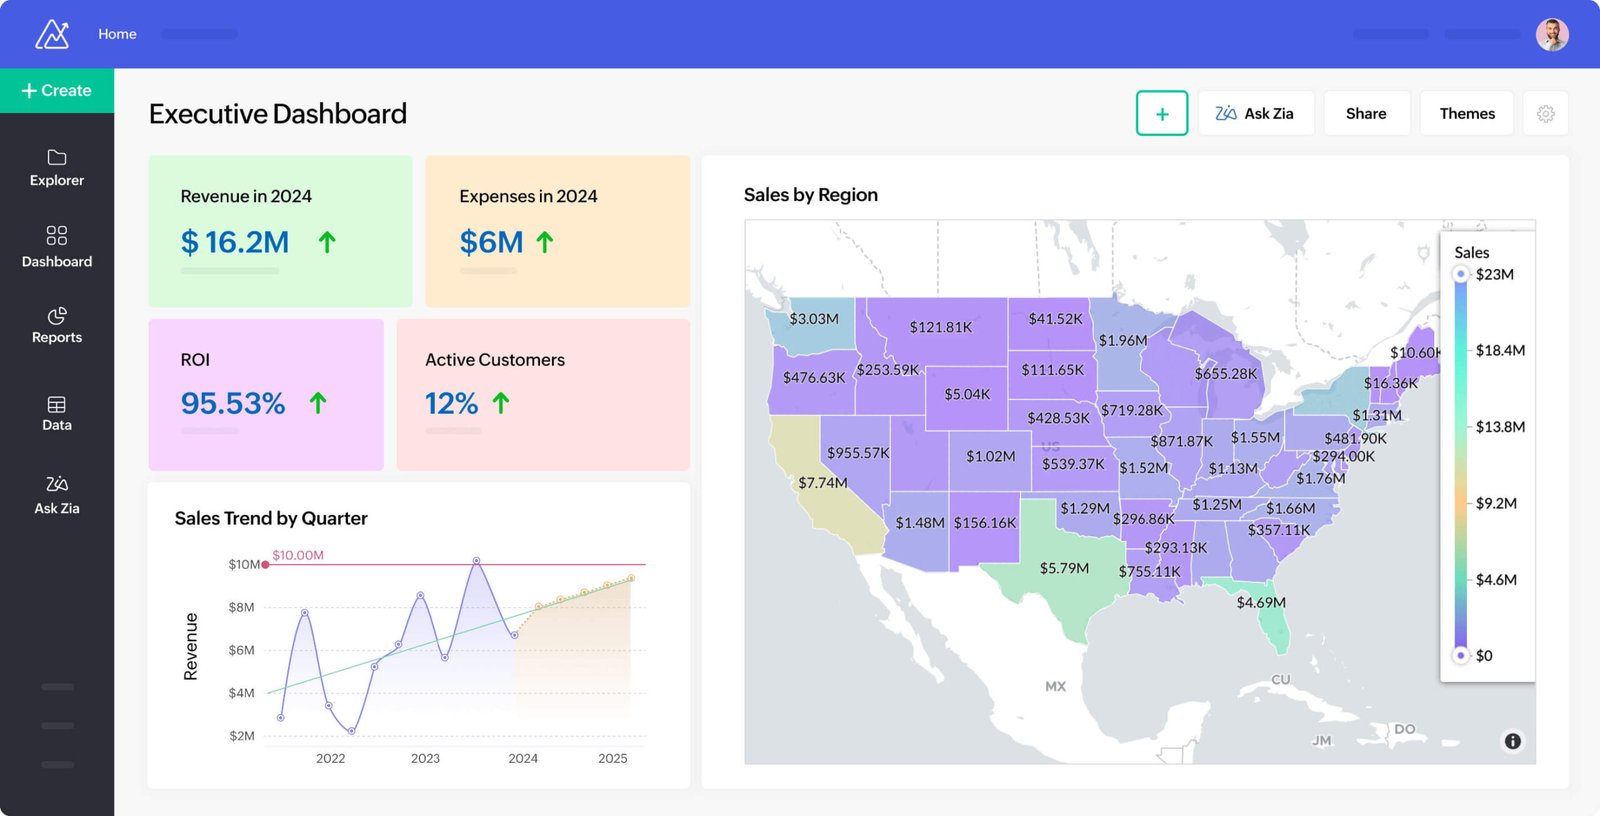
The exec six-pack.
Every other Departments page on this site ends with numbers flowing somewhere. This is where they land: one Zoho Analytics dashboard, six tiles, drill-down into every department, with EBITDA % and headcount productivity behind them.
revenue and gross profit by service line, drills into Sales and Finance
gross profit per producer, drills into Recruiting and HR’s ramp curves
fill rate against your floor, drills into Delivery, alert-wired
days sales outstanding against the 40 to 50 day staffing benchmark, drills into Finance and the watchdog
client concentration, the flag that fires when one client passes 25% of revenue
redeployment rate, drills into Delivery’s flagship automation, the 3-to-70 lever
systems the average agency exports from, every weekend
query joining front, middle and back office in Analytics
the DSO line the threshold alert watches for you, daily
ETL and pipeline project spend. The joins are native
Three moves, then it runs.
The definitions workshop
Before any chart exists, we agree what counts as a fill, a placement, GP and a redeploy. Once, in writing. Every dashboard, digest and board pack inherits the same definitions, which is what ends the whose-number-is-right argument.
The joins and the six-pack
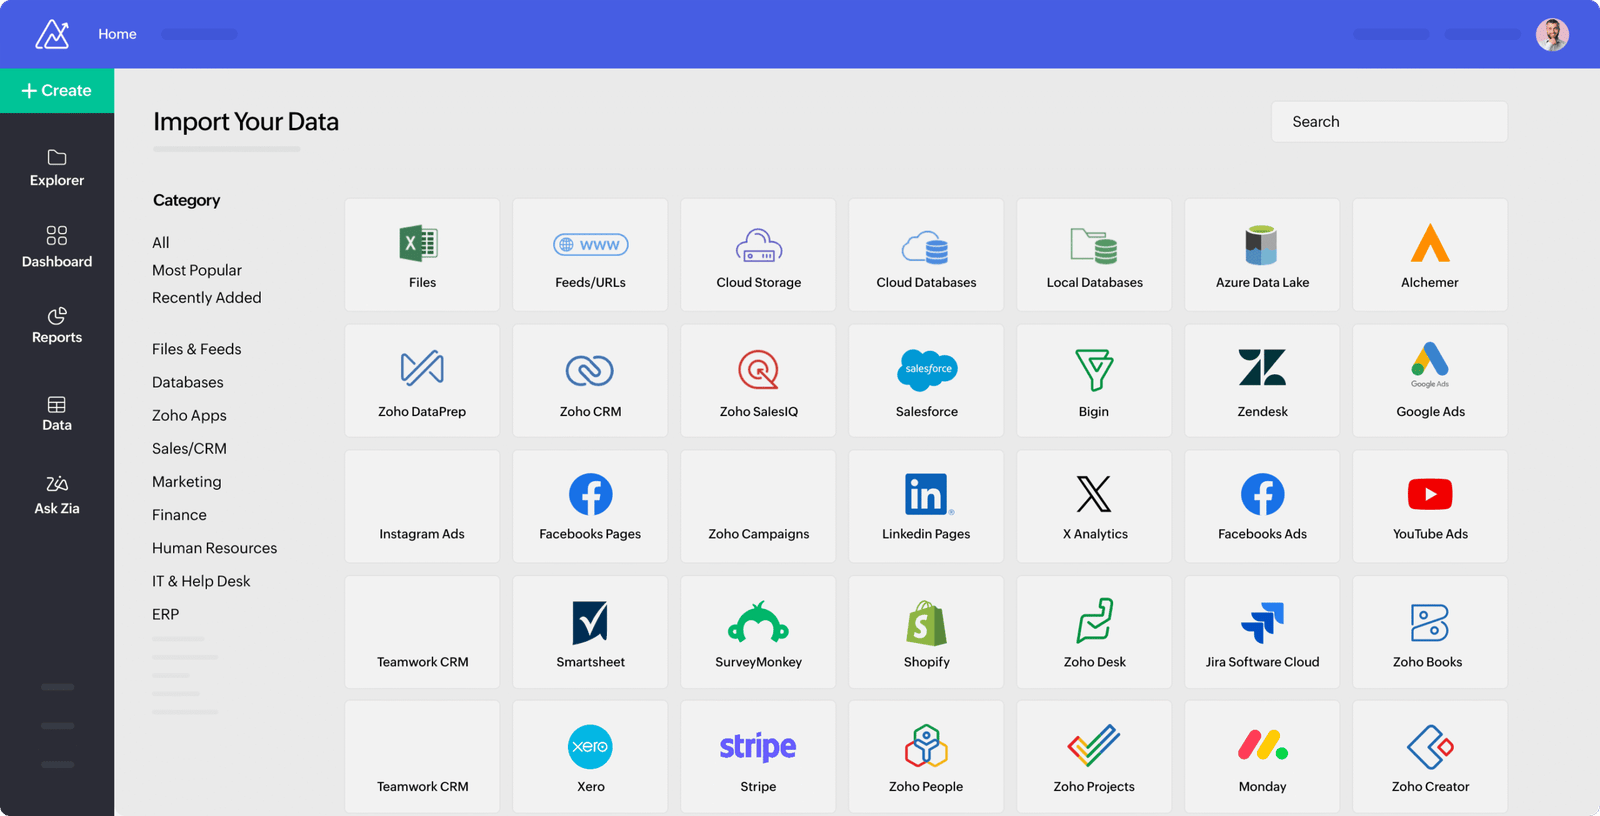
CRM, Recruit, Workerly, Books and People are joined natively in Analytics, and the exec six-pack goes live with drill-downs into every department. Outside sources, bureau and data providers, connect through the 50+ connectors in the same pass.
The cadence gets automated
The weekly digest, the threshold alerts and the month-end board pack are scheduled and pointed at the leadership channel. From that week on, the numbers come to you, on time, agreeing with each other.
What owners ask us about the numbers.
Is Zoho Analytics really a match for Tableau or Power BI?
For running a staffing agency, yes, and the honest caveats cut the other way. Tableau beats it on advanced visualization polish and huge-dataset performance; Power BI wins in Microsoft-heavy shops. But both still need someone to pipe staffing data in, and that integration project is the real cost. Analytics starts with the joins already made.
Our data is a mess across six systems. How do we get to one truth?
That’s the implementation, not your homework: CRM, Recruit, Workerly, Books and People land in one database as each department goes live, and Analytics joins them natively. The migration and the definitions workshop, what counts as a fill, a placement, GP, are part of the project.
What stays outside Zoho at this layer?
Whatever you choose to keep: a payroll bureau, a data provider, a beloved spreadsheet. Analytics connects to 50+ outside sources through native connectors, Zoho Flow and open APIs, so the outside tools appear in the same dashboards as the Zoho ones.
Do the dashboards need an analyst to maintain?
No. The exec six-pack, the weekly digest, the threshold alerts and the board pack are configured once, during implementation. Day to day, Ask Zia answers ad-hoc questions in plain English. No query language, no analyst queue.
How does this help if we sell the agency?
Buyers diligence staffing firms hard on data quality: provable GP by desk, real redeployment rates, client concentration, DSO history. One system with consistent definitions is a valuation story that survives due diligence, and it’s ready the day the first buyer calls.
The numbers differ by industry.
Bring the spreadsheet from
your last leadership meeting.
A Staffing Systems Review is a business conversation with people who have run recruiting businesses, 30+ years in recruitment and 14+ recruiting firms behind them. We rebuild that spreadsheet as a live dashboard during the call, and you leave with a gap map of your systems either way.
Book a Staffing Systems Review